6.3.1 arm-gdb Debug
With debug support enabled you can use arm-none-eabi-gdb (or gdb-multiarch) to debug the code used in the simulator.
Use arm-none-eabi-gdb with the .elf file as the parameter:
arm-none-eabi-gdb compiled_file.elf
and the command below to connect (1234 is the default port):
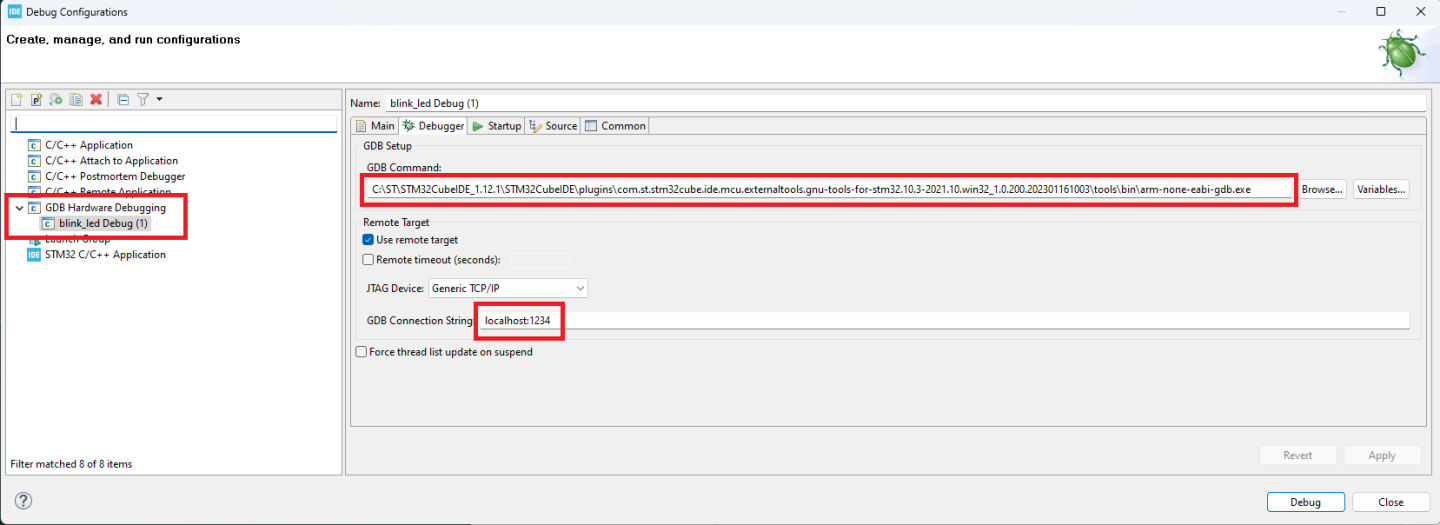
target extended-remote localhost:1234
Graphic debug mode can be made using eclipse IDE with Eclipse Embedded CDT or using platformIO in VSCode, just add the configuration lines below in the project’s platformio.ini file:
upload_protocol = custom
upload_command = C:\"Program Files"\PicsimLab\picsimlab_tool.exe loadbin "$BUILD_DIR/firmware.bin"
;upload_command = /usr/bin/picsimlab_tool loadbin "$BUILD_DIR/firmware.bin"

build_type = debug
debug_tool = custom
debug_port = localhost:1234
debug_build_flags = -O2 -g
debug_init_break = tbreak main
debug_init_cmds =
  define pio_reset_halt_target
      monitor system_reset
  end
  define pio_reset_run_target
      monitor system_reset
  end
  target extended-remote $DEBUG_PORT
  $LOAD_CMDS
  pio_reset_halt_target
  $INIT_BREAK
It’s possible to configure STM32CubeIDE to connect and debug using PICSimLab: